|
|
|
|
|
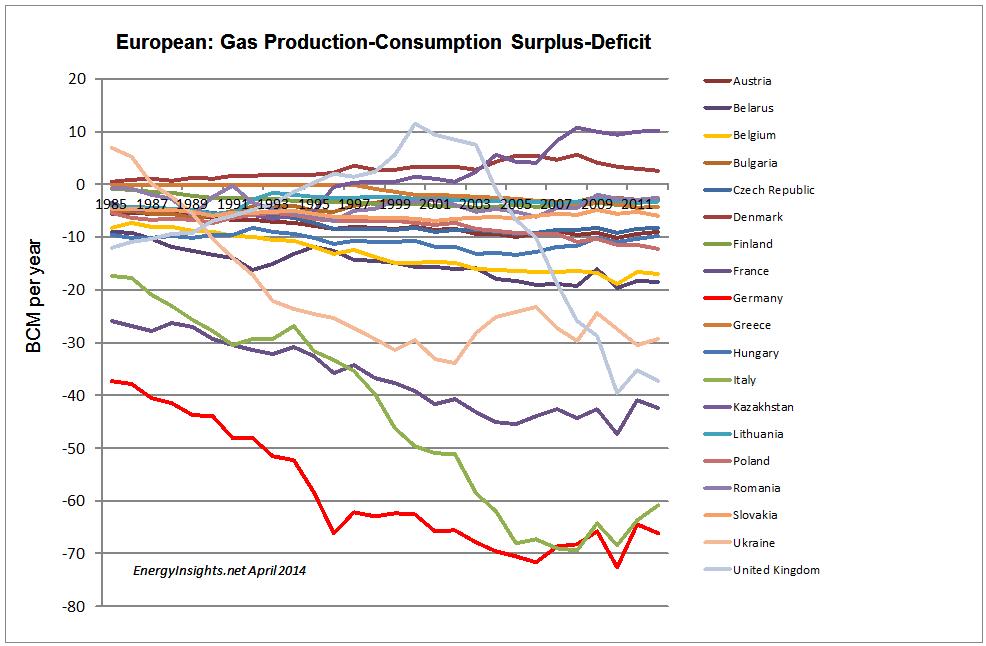
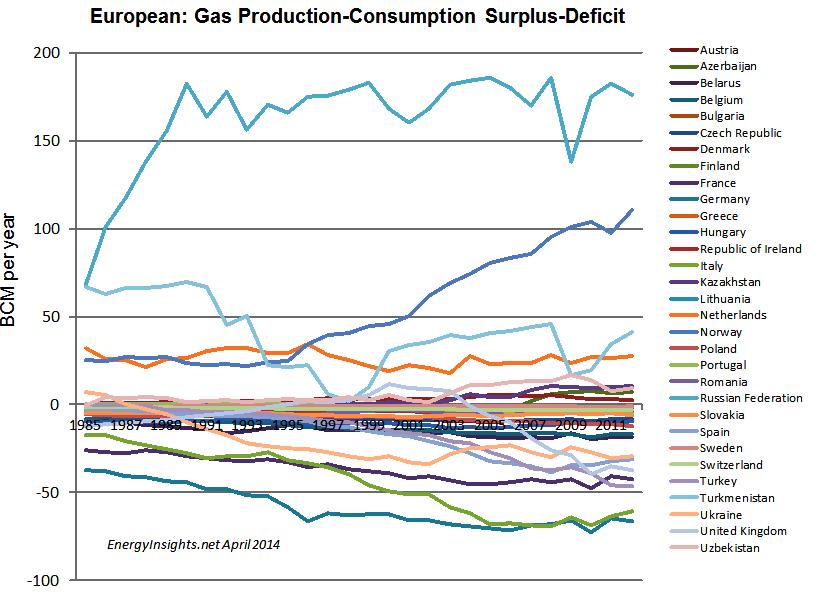
The Special Report below has been compiled to give you insights into the gas production-consumption surplus-deficit for each European country. This indicates which country is most exposed to an gas energy crisis that could be triggered by war or insecurity in Europe.
We have prepared the analysis over time to show trends in production-consumption deficit-surplus. Obviously the countries with the greatest surplus are the countries which have least to worry about if a severe gas crisis or gas shortage breaks out.
The countries with the largest gas exports or surpluses are Russia and Norway. The countries with the largest deficits are Germany, Italy, France and the UK.
We also cover Ukraine - how their deficit has increased markedly since 1985 and compare this against Russia's giant surplus that has also increased significantly since 1985.
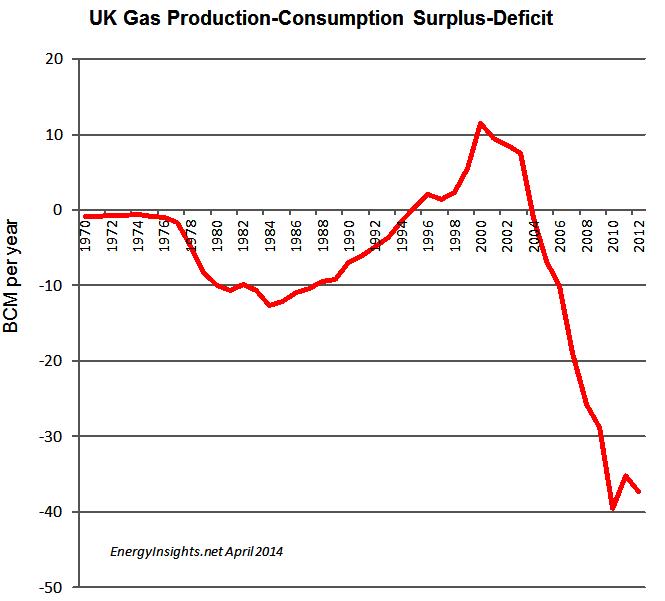
We take a look at the UK - which has a brief period of surplus from 1995 to 2005 - then went into a serious steep decline and deficit since 2005 as gas production collapsed - caused in large part by successive tax increases and lack of investment by successive governments from 1999 through to 2011.
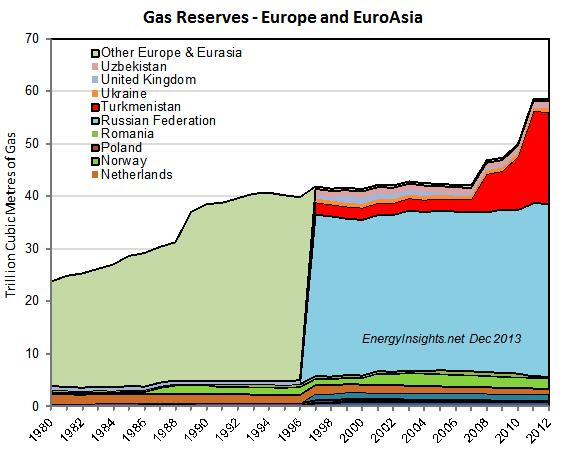
The Russian Federation has by far the largest gas reserves in Euro-Asia - it's reserves dwarf most other countries.
Russia's net gas production surplus (gas exports) is giant - particularly when compared to Ukraine's deficit (gas imports). Russia's exports skyrocketed in 1987 as Ukaine's imports also skyrocketed at the same time. Both countries have seen stable exports-imports since - with Ukraines imports peaking in 2002 when the economy was doing particularly well, and have dropped back somewhat as the country has been in recession and struggled economically in the last five years, prior to the current crisis in 2014.
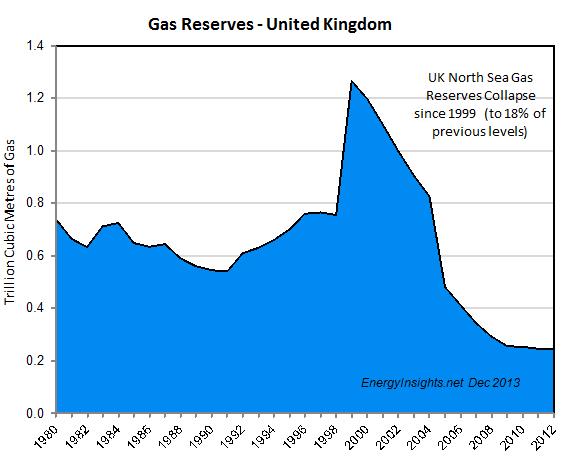
The UK's dependence on imports is increasing dramatically after the gas production collapse starting in 1999 and accelerating through 2003 onwards, as investments in new gas projects has dried up and North Sea taxes have been increased - on three occasions since the collapse began.
The net gas production surplus (exports) of Russia dwarfs all other European countries -except Norway.
UK Gas Production Collapse: The below chart shows the UK's collapse in gas reserves from 1999 onwards - this correlates well with successive tax increases from 1999 through to 2011 that helped make many smaller gas accumulations sub-economic. The UK has never recovered from Labour and the Coalitions tax increases - three in 12 years - that has helped make the UK the most unstable petroleum fiscal regime in Europe and one of the most unstable in the world.
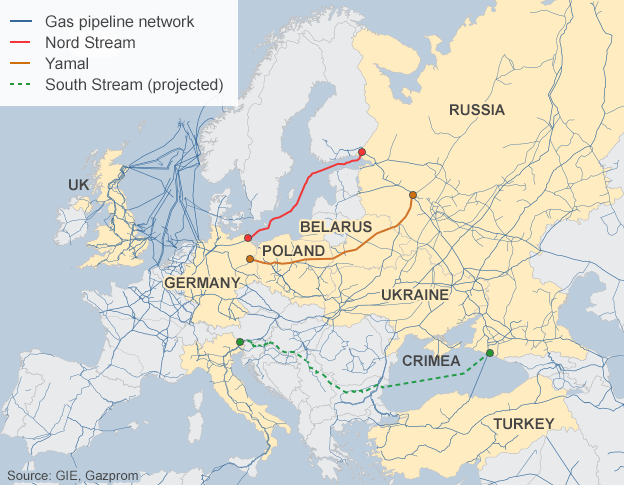
the map below shows the various actual and planned gas pipelines that are used to export gas from Russia to western Europe.
