88A: Massive oil boom - the winners and losers - be prepared
13-10-2007
Super-Boom: As EnergyInsights.net website visitors will be aware, we are predicting a super-boom in oil prices as global oil production plateaus at 83.5 million barrels a day whilst underlying demand is forecast to rise according to our unique analysis (assuming prices of $70 / bbl) by at least an additional 1.3 million barrels a day per year for the next 8 years. The only realistic way that demand will reduce is if oil prices skyrocket.
What Oil Price? In the UK, 80% of petrol prices are tax. Most people will not alter their driving behaviour unless petrol prices double so this would imply oil prices rising from $70 / bbl to $420 / bbl! Even if taxes were only 50%, it would imply oil prices rising from $70 / bbl to $140 / bbl. Because we believe global peak oil production will be from now until 2012 a plateau of around 83.5 million barrels day (according to our unique analysis that ha taken years to prepare) we predict oil prices will rise to $125 / barrel by end 2008 because of supply shortages. All this assumes Saudi Arabia can ramp up production from 8.8 million barrels a day (June 2007) to 11 million barrels a day (end 2008) a tall order.

Get Prepared: So investors, get ready for the biggest oil price hike you have ever seen and please remember, you heard it hear first. Our aim is to provide the very best insights to our customers this will allow you to position your property portfolios to make sure that when Peak Oil arrives (if it has not already arrived), you will benefit rather than suffer.
As oil prices rise, inflation will rise, unemployment will likely increase, GDP growth will drop and asset prices will come under pressure. The countries with the weakest economies with most negative exposure to high oil prices will suffer the most the net losers we call them. The net winners will be the oil exporting nations, and strongest growing manufacturing economies.
We assumed that oil price would rise from $70 / bbl in early August 2007, then by 30% per annum until 2011 until they reached $200 bbl / bbl - demand would then drop and oil prices would rise by a further 15% then 10% per annum until 2015. This scenario assumes Chinas economy continues to grow at 10% per annum, India at 7% per annum and USA by 2.0 - 2.5% per annum. These oil prices will hit global GDP growth but would not lead to a financial meltdown or recession in most countries.


Winners and Losers: The key is a MASSIVE transfer of wealth from the developed non oil exporting nations to the developing oil exporting nations. The biggest wealth winners are:
The biggest wealth losers are:
-
USA
-
-
Japan
-
South Korea
-
Germany
-
India
However, China and India will still boom because of their strong manufacturing lead exports. Germany would benefit from its technology and high quality manufacturing. Korea and Japans economies would stagnate as energy prices increase costs. The USA would suffer, but low priced coal and electric power would help. The US consumer would be hit hard by high gasoline prices because gasoline tax is so low at present hence gasoline prices could triple. The US public would need to trade in their SUVs for efficient Japanese imported cars the Humvie would become a dinosaur something people would laugh at as a relic of a bygone age.
The Real Losers: However, the biggest overall losers will be countries not mentioned in these charts the forgotten about poor developing countries with no oil production, many in Africa, with massively expanding populations example:
-
Kenya
-
Mali
-
Senegal
-
Ethiopia
-
Eritrea
-
Mozambique
-
Chile
-
San Salvador
-
Pakistan
-
Bangladesh
These countries will be knocked with massive new oil import bills they would likely have constant fuel shortages, food distribution problems, water shortages, blackouts and famine may become widespread. The oil producing & exporting nations would need to help them they simply would not be able to afford the high oil prices and would not have any technology substitutes.
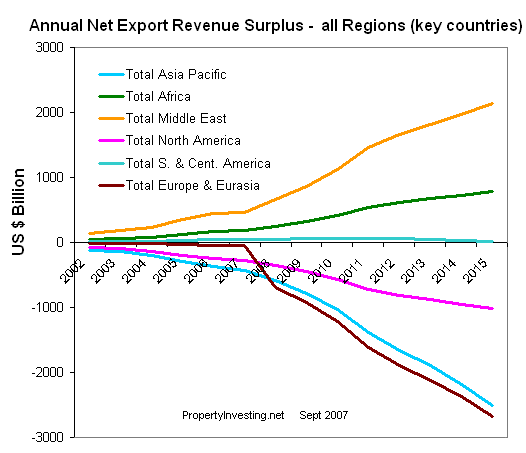
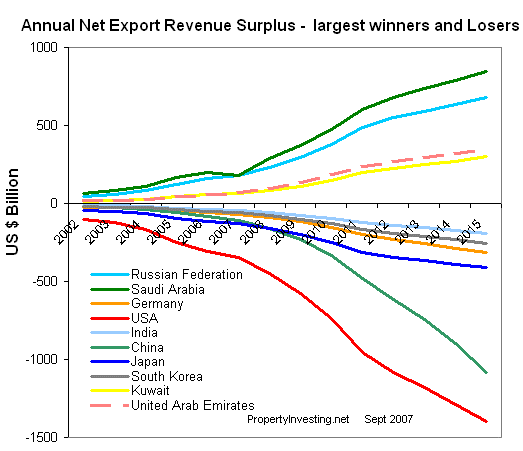
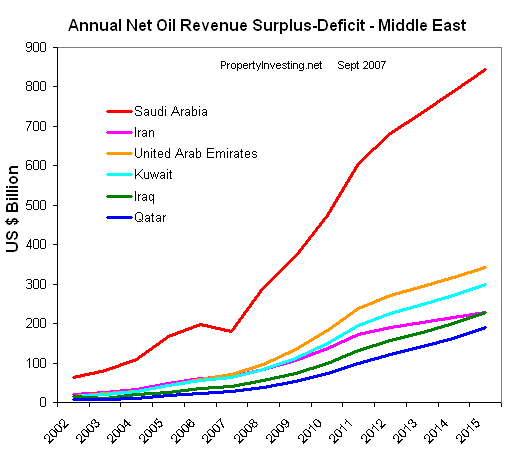
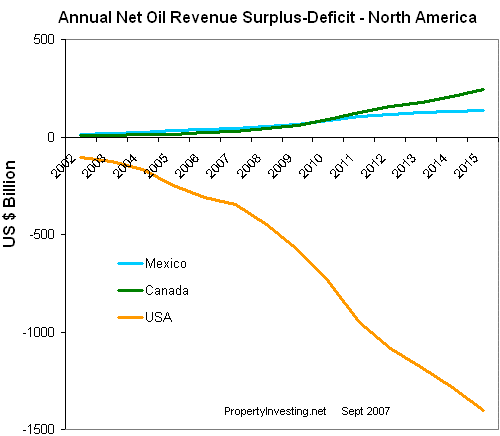
Our Unique Analysis: For an overview, please look at the below graphs. We have spent the last year modeling each countrys oil production (forecast) and oil consumption (forecast). We then obtained the net oil import or export. We then multiplied this by the predicted oil price. This equals the net oil revenue deficit or surplus per country. All key countries are included check out where you live!
$ Trillions of Wealth Transferred every Year: As you can see, the numbers are mind boggling. If our predictions are true which we believe they will turn out to be both Saudi Arabia and Russia will have oil income surpluses of $1 Trillion a year by 2015. Meanwhile, China would have a deficit of -$1.1 Trillion and USA -$1.4 Trillion. So two new economic superpowers will emerge - Russia and Saudi Arabia. China will also be a superpower in Manufacturing and Trade and this will allow them to afford the high oil prices. USA will be struggling but USA has plentiful coal, some oil shale and other resources to help soften the blow. Italy and Spain will struggle with oil deficits of -$165 billion per year. The UK will escape relatively lightly with a deficit of only -$72 Billion. Germany would suffer from a deficit of -$316 Billion a huge burden albeit their strong manufacturing export trade would help soften the blow.
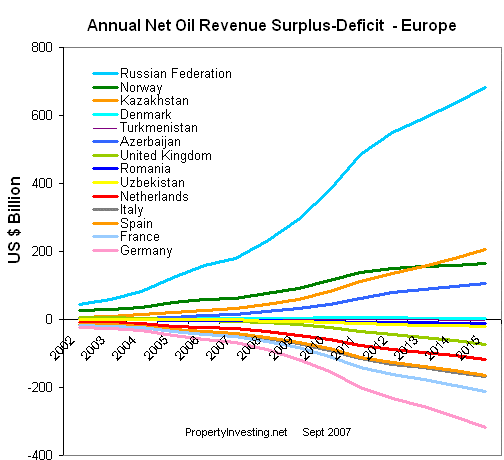
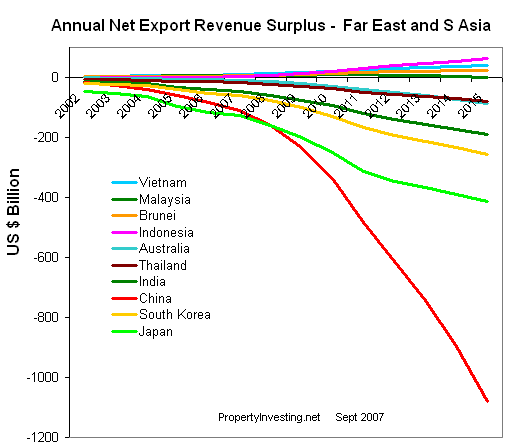
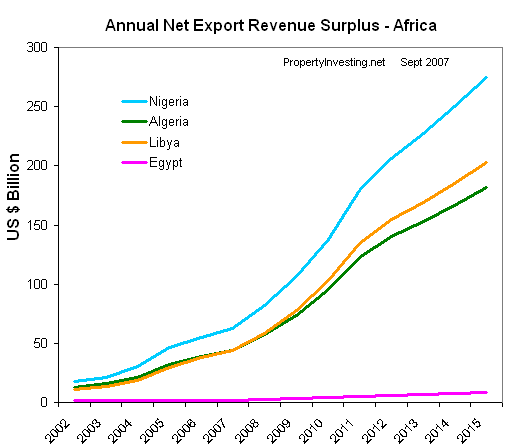
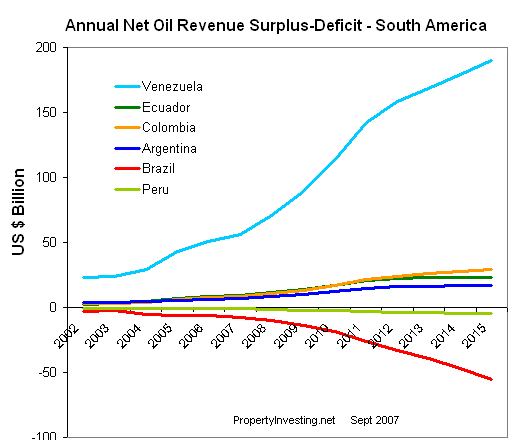
Please understand, energy has been far too cheap for far too long. People traveling 5000 km for a weekend holiday flight from UK to Greece, or Houston to Florida will become a thing of the past. Commuting costs will double. Long distance commuting will become prohibitive. We urge you to consider the ramifications of Peak Oil now and make sure your property portfolios are hedged to protect you from the downside. If you are really worried about this, sell up! If you want to take advantage, then read our special reports on where to invest in to maximize return from the coming oil price boom.
As for Climate Change (ref; we had fears of an Ice Age and Nuclear Winters in the 1970s and 1980s) Peak Oil will have far wider implications for mankind, economic prosperity and the environment. It might lead to lower emissions eventually as people finally forced to switch from oil to renewable and more efficient forms of transport. You definitely need to consider this in your investment strategies central city is better than 6 miles drive or suburbia. Oil exporting country is better than oil importing. Follow the oil revenue money the emerging winners will likely be:
-
Russia financial boom, oil, gas, coal the real winner
-
UAE financial boom, oil and gas another real winner
-
Saudi oil a winner
-
China - strong manufacturing growth, much coal
-
India - strong manufacturing growth, much coal
Some examples of booming oil towns and cities (areas exposed to the oil business) are:
In these oil boom towns, GDP will rise in the range 5-15% per annum would be expected. However, in the losing countries, GDP rises of 0-2% would be considered high, with many going into reverse and seeing annual house price deflation for many years at say 0 to -2% per annum. Example would be Italy, Greece, possible some parts of Spain, eastern Germany, Japan, South Korea, and African non oil exporting countries. Asset prices in the USA would likely stagnate, except most of Texas, some parts of California and areas exposed to coal and oil shale in Wyoming and NW Colorado.
Our charts are truly unique we have the back-up data for every country to support our predictions.
If you have any comments on the analysis, predictions or insights, please contact us on enquiries@energyinsights.net
Printer Friendly version...
Printer Friendly version...


