|
|
|
|
|
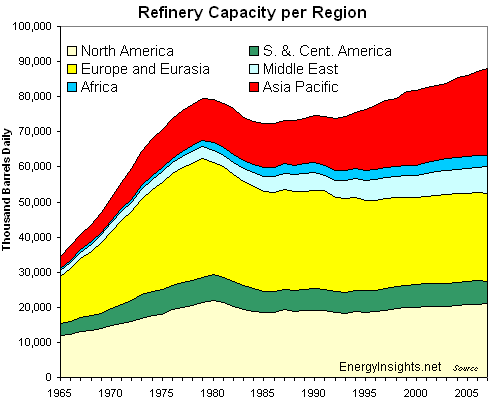
| Refinery Capacity per Region - Global - Worldwide | ||
 | ||
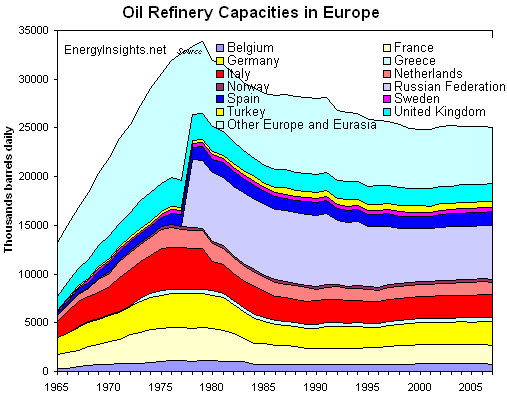
| Oil Refining Capacities in European and EuroAsia Region (incl Russia) | ||
 | ||
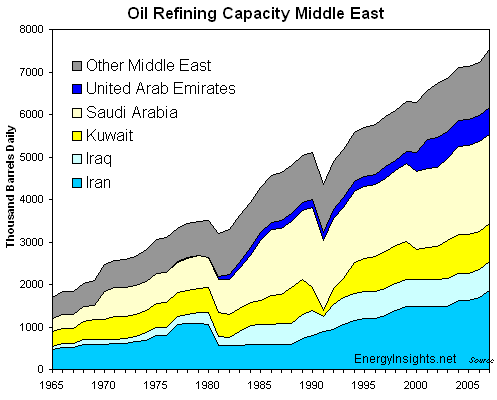
| Oil Refining Capacities in the Middle East Region | ||
 | ||
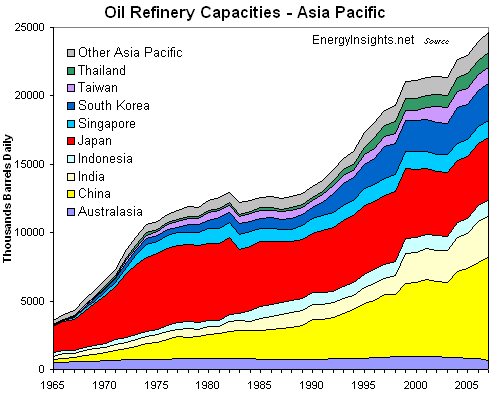
| Oil Refining Capacities in Asia Pacific and South Asia Region | ||
 | ||
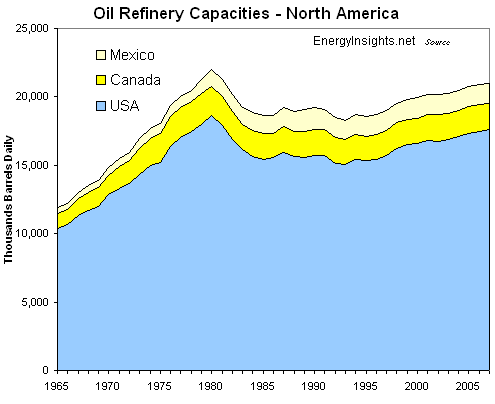
| Oil Refining Capacities in North America Region | ||
 | ||
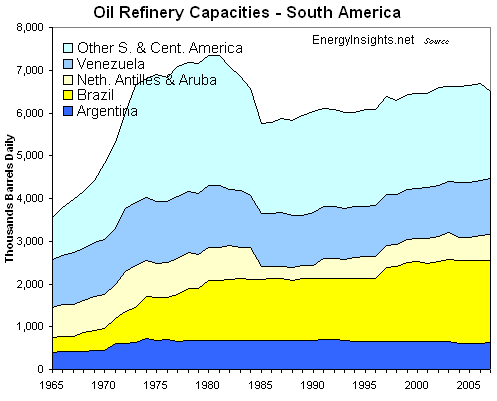
| Oil Refining Capacities in South America Region | ||
 | ||
|
Oil refinery in California USA
| ||
| ||
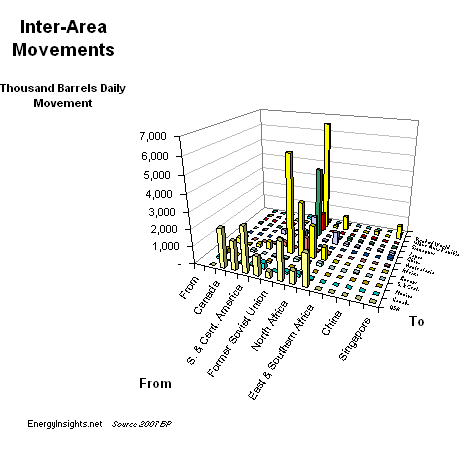
| Inter-Area Regional Oil Trade Movements - this 3D presentation shows the inter-area worldwide oil trade movements. | ||
 | ||
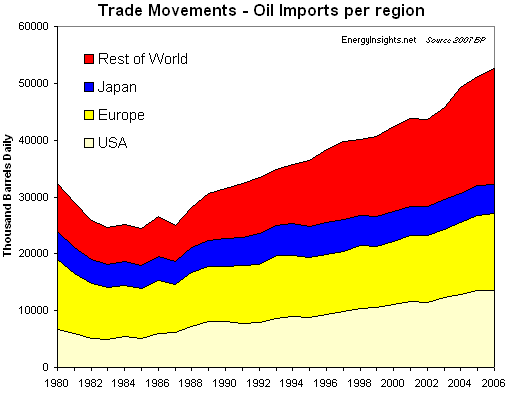
| Oil Trade Movement Imports Per Region - this chart shows the historic overall increase in oil trade import movements between the regions. China is included in the Rest of World - and the big increase since 2002 is largely from China. | ||
 | ||
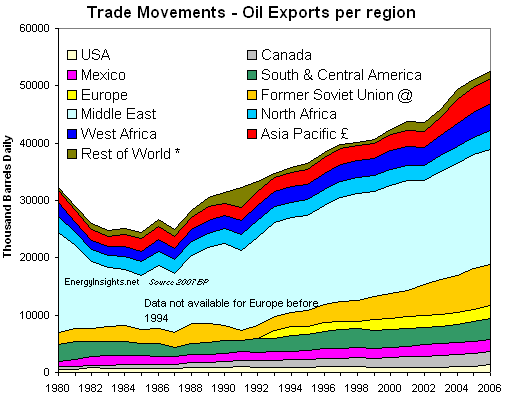
| Oil Trade Movement Exports Per Region - this chart shows the historic overall increase in oil trade export movements between the regions. The Middle East has shown the largest volume growth in exports since 1985. The Former Soviet Union has shown a very large increase as a percentage. Most other region have grown in exports. | ||
 | ||
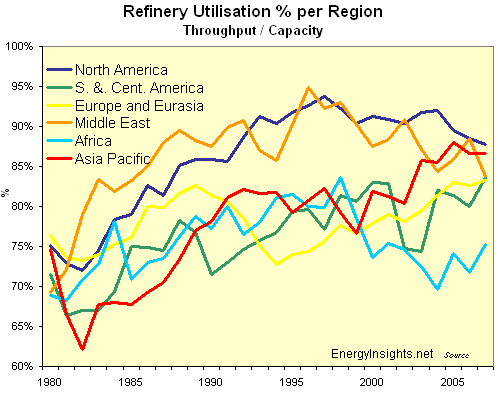
| Oil Refinery Utilisation - percentage within each region - from 1980 to present | ||
 | ||
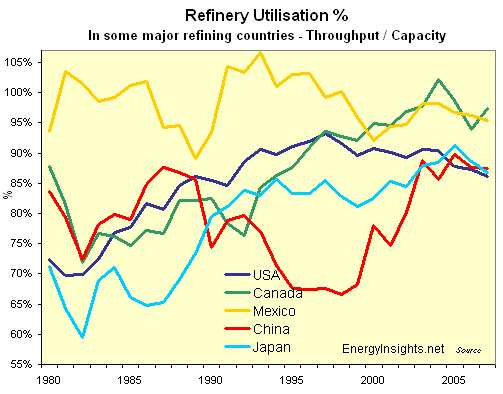
| Oil Refinery Utilisation - percentage for largest refining nations - from 1980 to present. Note - capacity has generally been tightening in the last eight years which has contributed to margins rising and refining new and existing business commerciality improving. | ||
 | ||
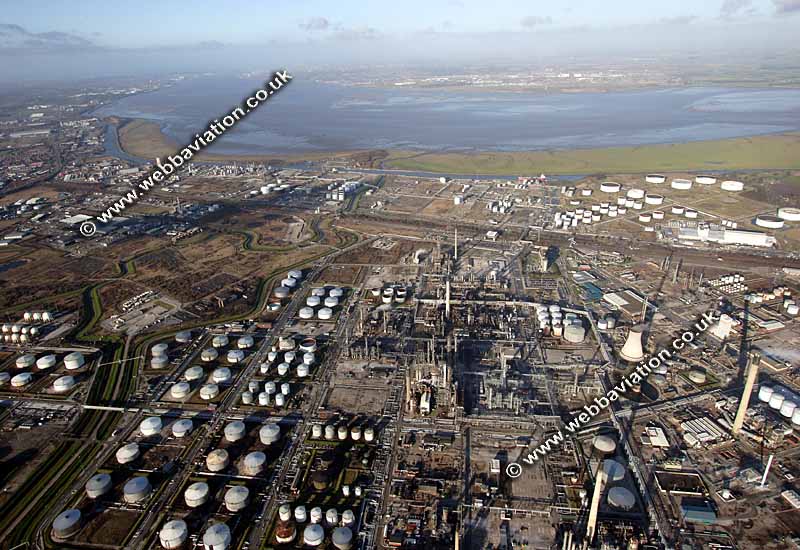
Stanlow Refinery in the UK -
between Liverpool and Manchester next to Mersey
